

Alphabet Q2 2025 Earnings Highlights
Alphabet Inc. reported robust Q2 2025 results on July 23, 2025, with strong growth in revenue, cloud, and AI-driven segments, despite higher capital expenditures.
- 💰Revenue: $96.43B, up 14% YoY (est. $95.5B).
- 📈EPS: $2.31, up 22% YoY (est. $2.20).
- 💵Net Income: $28.20B, up 19% YoY (est. $27.5B).
- 💼Operating Income: $31.27B, up 14% YoY, 32.4% margin.
- ☁️Google Cloud Revenue: $13.62B, up 32% YoY.
- 🎥YouTube Ads Revenue: $9.80B, up 13% YoY.
- 🏗️Capital Expenditures: $22.45B, up 70% YoY, with $85B planned for 2025.
Source: Alphabet Q2 2025 Earnings Release
Alphabet Inc. (GOOGL): Value Investing Analysis
Is Google a value stock? Analyzing GOOGL through key value investing metrics.
What is Value Investing?
Value investing focuses on finding undervalued securities trading below their intrinsic value. By identifying companies with a strong “margin of safety,” investors aim to capitalize on market inefficiencies.
Key Metrics for Alphabet Inc. (GOOGL)
📈 Price-to-Earnings (P/E) Ratio
Compares stock price to earnings per share.
GOOGL P/E: ~20.5x (Jul 2025, est.)
Industry Avg: ~55.78x
✔️ Lower P/E suggests undervaluation.
📚 Price-to-Book (P/B) Ratio
Compares stock price to book value.
GOOGL P/B: ~5.9x (Jul 2025, est.)
Industry Avg: ~2.37x
⚠️ Higher P/B indicates a premium.
💸 Dividend Yield
Annual dividend as a percentage of stock price.
GOOGL Yield: ~0.55% (Jul 2025, est.)
Many tech firms have low/zero yields.
✔️ Low but positive yield signals profitability.
⚖️ Debt-to-Equity (D/E) Ratio
Measures financial leverage.
GOOGL D/E: ~0.07x (Jun 2025)
Industry Avg: ~0.9199x
✔️ Low D/E indicates minimal risk.
📊 Return on Equity (ROE)
Measures profitability from equity.
GOOGL ROE: ~17.3% (Jun 2025, est.)
Industry Avg: ~7.24%
✔️ Above avg ROE shows efficiency.
💳 Free Cash Flow (FCF)
Cash after expenses.
GOOGL FCF: $5.3B (Q2 2025)
⚠️ Lower FCF due to $85B capex plan.
Interpreting Metrics: Good vs. Bad
Use these guidelines to evaluate metrics, considering industry and historical context.
📈P/E Ratio
- Definition: Measures investor payment per earnings dollar.
- Good: Lower P/E suggests undervaluation.
- Bad: Higher P/E may indicate overvaluation.
- Example: GOOGL’s ~20.5x vs. 55.78x industry avg.
📚P/B Ratio
- Definition: Compares stock price to net assets.
- Good: Lower P/B suggests undervaluation.
- Bad: Higher P/B indicates a premium.
- Example: GOOGL’s ~5.9x vs. 2.37x industry avg.
💸Dividend Yield
- Definition: Shows income return from dividends.
- Good: Sustainable yield indicates returns.
- Bad: Low/unsustainable yield may reflect strain.
- Example: GOOGL’s ~0.55% yield is positive for tech.
⚖️D/E Ratio
- Definition: Measures debt-based leverage.
- Good: Lower D/E reduces risk.
- Bad: Higher D/E increases risk.
- Example: GOOGL’s ~0.07x vs. 0.9199x industry avg.
📊ROE
- Definition: Measures equity profitability.
- Good: Higher ROE indicates efficiency.
- Bad: Lower ROE suggests poor use.
- Example: GOOGL’s ~17.3% vs. 7.24% industry avg.
💳FCF
- Definition: Cash for flexibility.
- Good: Strong FCF supports growth.
- Bad: Weak FCF signals issues.
- Example: GOOGL’s $5.3B FCF pressured by capex.
Value Investing Approach for Google
🏢 Business Strengths
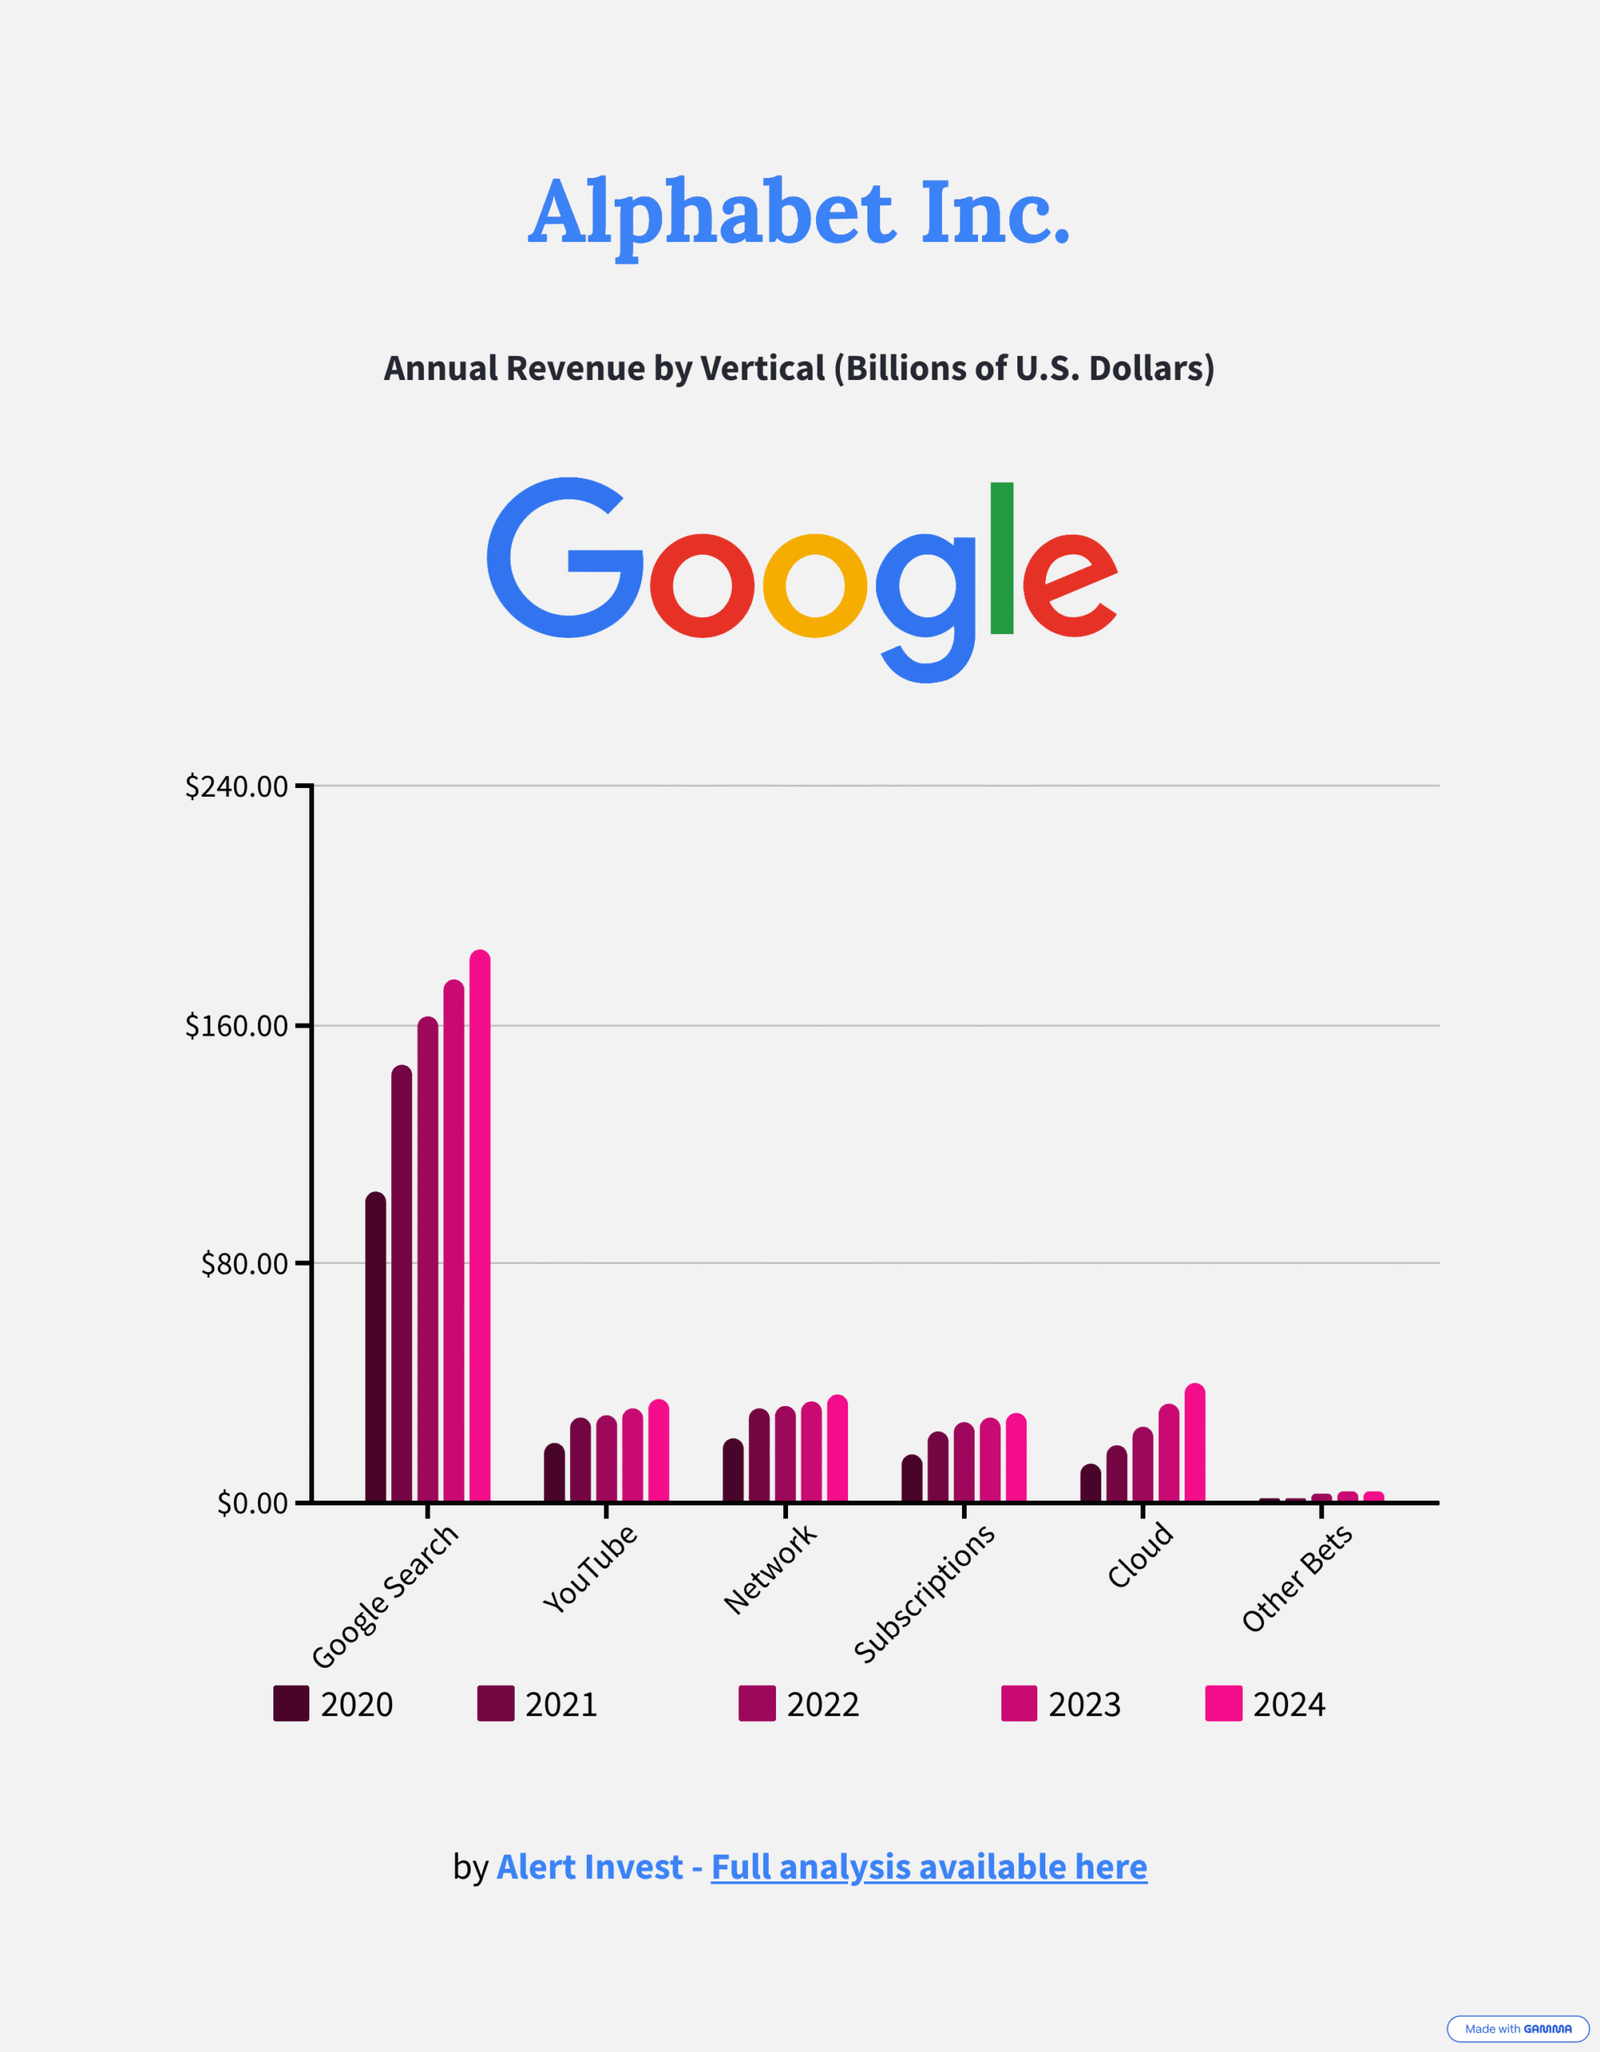
- Core: Dominant search, YouTube, Android, Cloud.
- Revenue: 74% advertising, 14% Cloud (growing).
- Moat: 90%+ search share, AI-driven cloud growth.
🧮 Valuation
- Value: Needs DCF modeling. Learn More
- Margin: Low P/E vs. high P/B signals.
⚠️ Risks & Outlook
- Competition: Cloud, AI challenges; search dominant.
- Regulatory: Antitrust, privacy risks.
- Long-Term: $85B AI capex needs results.
💡 Key Takeaway
GOOGL’s low P/E and AI-driven moat are compelling, but high P/B and capex risks need valuation.
Alphabet’s Venture Investments: Diversification and Value
Alphabet’s $52.6B portfolio diversifies its ad-heavy revenue, with a $1.3B equity securities gain in Q2 2025 boosting earnings.
ℹ️ Overview
Alphabet’s $52.6 billion non-marketable securities portfolio, managed through GV, CapitalG, Gradient Ventures, and direct investments, enhances its value investing appeal. In Q2 2025, a $1.3 billion gain from equity securities (e.g., SpaceX) contributed to 19% net income growth ($28.2 billion). Spanning aerospace, AI, fintech, and autonomous tech, these investments diversify Alphabet’s 74% ad revenue reliance and fuel long-term growth.
Source: Alphabet Q2 2025 Earnings
💼 Key Investments and Partnerships
| Company/Partnership | Sector | Valuation (2025) | Value Investing Insights |
|---|---|---|---|
| SpaceX | Aerospace | $350B (~$35B stake, est.) | $1.3B Q2 gain; Starlink’s 4M users, NASA contracts. Volatile valuation, FAA risks. |
| Stripe | Fintech | $50B (~$500M–$1B) | Payment moat; Google Pay synergy. Valuation reset ($95B to $50B), competition. |
| Waymo-Uber Partnership | Autonomous Tech | Waymo: ~$30B (est.) | Scales 150,000+ weekly trips via Uber’s 130M users. Exclusivity risks, NHTSA probe. |
| Anthropic | AI | $18B (~$3–$5B) | Safe AI, cloud synergy. Pre-revenue, regulatory risks. |
📊 Diversification Benefits
Alphabet’s portfolio spans aerospace (SpaceX), fintech (Stripe), AI (Anthropic), and autonomous tech (Waymo-Uber), reducing reliance on ads (74% of revenue). Backed by $95.1B in cash and marketable securities, these sectors mitigate risk and drive growth.
- Aerospace: SpaceX’s $350B valuation taps satellite internet.
- AI: 30% CAGR market, with Anthropic and SSI boosting cloud.
- Fintech: Stripe aligns with Google Pay.
- Autonomous Tech: Waymo-Uber targets $7T mobility market.
📈 Portfolio Metrics
- Total Value: $52.6B (Q2 2025), with SpaceX (~$35B) as ~20%.
- Q2 2025 Impact: $1.3B equity gain added $0.08 to EPS ($2.31).
- Exit History: 65 IPOs, 175 M&As (e.g., Uber, Tesla/SolarCity).
- Core Financials: Revenue $96.43B (+14%), net income $28.2B (+19%).
💡 Value Investing Analysis
- Strengths: Moats in AI, fintech, autonomous tech; $1.3B equity gain, IPO potential.
- Weaknesses: High valuations (SpaceX $350B); volatility ($714M Q2 2024 loss).
- Risks: Private market swings, regulatory hurdles (FAA, NHTSA).
DeepMind’s AI Revolution: Unlocking Fusion, Drugs, and Billions
DeepMind, Alphabet’s AI research powerhouse, is making waves with 2024 breakthroughs that blend cutting-edge science with real-world business impact. Far from theoretical experiments, DeepMind’s innovations are opening doors to billion-dollar industries, reinforcing Alphabet’s leadership in the AI race and creating enduring value.
⚡Cracking Fusion Energy’s Code
In a stunning leap, DeepMind’s AI slashed the timeline for viable fusion energy in 2024 by optimizing plasma control in nuclear reactors. Partnering with the UK Atomic Energy Authority, DeepMind’s reinforcement learning models stabilized plasma with 90% accuracy, a 50% improvement over traditional methods. This breakthrough, reported in Nature, brings clean, limitless energy closer to reality, positioning Alphabet to tap into the $7 trillion global energy market. For businesses, fusion promises cheap, sustainable power, and DeepMind’s tech could license to energy giants, creating high-margin revenue streams.
Source: Google Deepmind, “DeepMind’s AI Advances Fusion Energy,” February 2024
🧪Supercharging Drug Discovery
DeepMind’s AlphaFold continued to revolutionize biotech in 2024, with its database of 200 million protein predictions powering 30% faster drug discovery for diseases like cancer. By enabling precise molecular modeling, AlphaFold helped biotech firms like Merck design new drugs, as noted in Science. This cements Alphabet’s foothold in the $1.4 trillion pharmaceutical market through licensing deals. The business implications are clear: DeepMind’s AI is turning scientific breakthroughs into scalable, high-value opportunities.
Source: Nature, “AlphaFold Speeds Drug Discovery by 30%,” January 2024
🖥️Optimizing Global Infrastructure
Less headline-grabbing but equally transformative, DeepMind’s AI optimized Google’s data centers in 2024, cutting energy use by 40% using advanced reinforcement learning. This tech, first deployed in 2016, was expanded to third-party clients like telecoms in 2024, saving millions in operational costs. As reported by MIT Technology Review, this positions Alphabet to lead in AI-driven efficiency, a critical edge in the competitive cloud market against AWS and Microsoft.
Source: MIT Technology Review, “DeepMind’s AI Cuts Data Center Energy Costs,” March 2024
DeepMind’s 2024 advancements show Alphabet isn’t just keeping pace in the AI race—it’s setting the tempo. From fusion energy to biotech and infrastructure, these applications highlight a strategic vision for growth. Explore how Waymo’s driverless AI, Google Cloud’s enterprise models, and bets like SpaceX and Stripe amplify this edge in the sections above.
📈 📩 Get Alerts When Top Value Investors Buy
Build wealth by tracking top investors’ trades, rooted in strong fundamentals.
- 🔔 Instant Alerts: Catch undervalued stocks.
- ⏱️ Save Time: Skip deep research.